

Streaming Audience Measurement Explainer
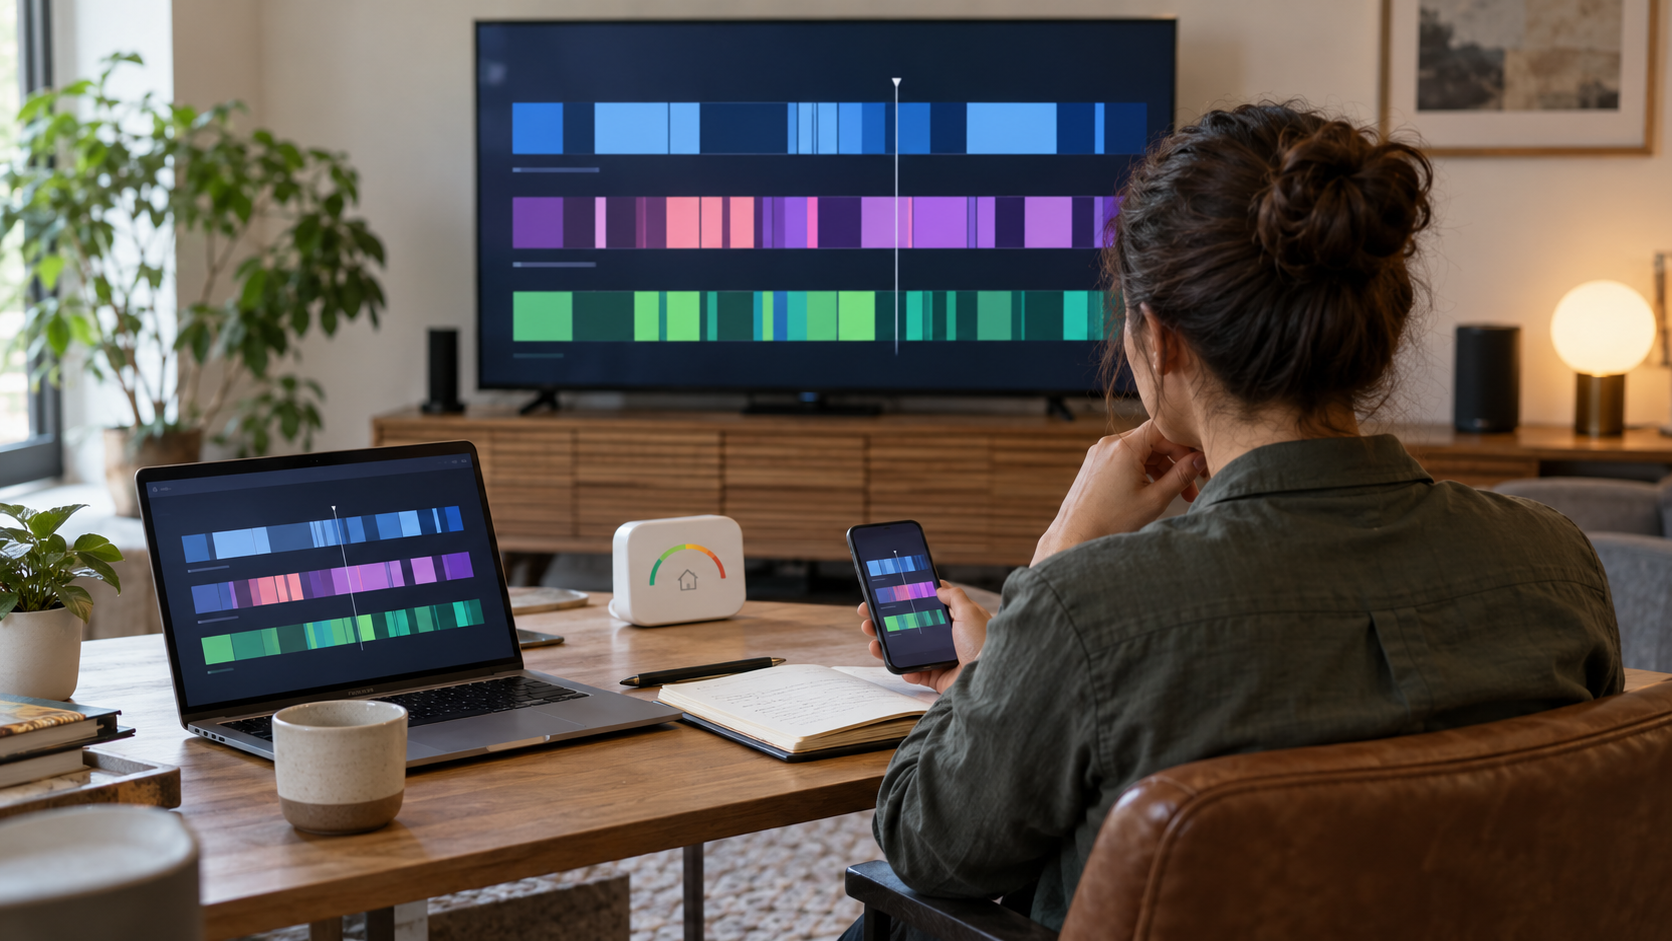
Streaming audience measurement estimates how people use video services across connected televisions, computers, phones, and other devices. It is more complicated than counting account starts. A household can share an account, several people can watch one screen, a program can play without attention, and services define viewing events differently. Independent measurement firms and platforms therefore combine several kinds of data and metrics to answer questions about reach, duration, audience composition, programs, devices, and advertising exposure.
Device or platform logs can record streams, starts, duration, application use, and technical identifiers at large scale, but they may not reveal exactly who was watching. Panels recruit known households or individuals and use meters, surveys, or wearable devices to connect viewing with demographic information. Automatic content recognition, audio watermarking, and digital signatures can identify programs or ads. Modern systems may combine large datasets with panels that correct representation and estimate people rather than devices.
Metrics answer different questions. Total minutes emphasizes time spent; unique viewers or households emphasizes reach; average minute audience estimates how many people watched during an average minute; completion considers how much of a program was consumed. A chart of platform share is not the same as a ranking of individual shows. Live viewing, delayed viewing, mobile use, out-of-home screens, short clips, and co-viewing may be included differently depending on the service and product.
Comparisons require consistent definitions, coverage, geography, and measurement windows. A platform's first-party figure may use a threshold unlike an independent rating. A monthly share can rise because one service gains viewing or because total television use changes. Smaller programs create more sampling uncertainty, and unidentified streaming activity may fall into an other category. Privacy rules and consent also limit how person-level data can be collected, linked, retained, and reported. Streaming numbers are useful when the methodology is visible. Before treating a figure as proof of popularity, ask who measured it, which devices and services were covered, whether it represents people, households, accounts, starts, or minutes, and how repeat viewing was handled. Also check the date and territory. The most responsible interpretation compares like with like and treats measurement as an estimate built for a stated purpose, not as a complete census of attention or cultural impact. A practical way to read or discuss Streaming Audience Measurement is to begin with the basic definition and then identify the choices made in a particular example. Streaming measurement estimates viewing across services and devices by combining identification technology, large datasets, and representative panels. Next, ask who sets the relevant rules, who performs the work, and which results follow from creative judgment, law, contracts, technology, budget, or production limits. Similar-looking examples can operate differently because their audience, market, format, timing, and agreements are different. Coverage varies by device, platform, territory, window, live or delayed use, and whether out-of-home or mobile viewing is included. It also helps to distinguish a formal industry category from an informal critical label or one organization's current practice. That separation keeps a memorable anecdote from becoming a false universal rule. Dates and territories matter: tools, distribution systems, audience behavior, and standard agreements change, while older examples can preserve assumptions that no longer apply everywhere. When a claim sounds absolute, compare it with a second kind of source and look for the conditions under which the claim is true. Then trace the process from the visible result back through the less visible decisions, handoffs, and quality checks that produced it. A trustworthy claim names the measurement source, date, territory, population, metric, and important methodological limits. Finally, compare the example with a contrasting case and note which part of the definition still holds. This method keeps the explanation grounded, highlights the people and systems behind the outcome, and leaves room for reasonable disagreement about hybrid or borderline cases.
Streaming measurement estimates viewing across services and devices by combining identification technology, large datasets, and representative panels.
Platform logs provide scale, while panels can connect devices and streams with people, demographics, and co-viewing estimates.
Minutes, reach, households, average audience, starts, and completion rates describe different aspects of viewing and are not interchangeable.
Coverage varies by device, platform, territory, window, live or delayed use, and whether out-of-home or mobile viewing is included.
First-party and independent figures may both be valid while using thresholds and populations that make direct comparison misleading.
A trustworthy claim names the measurement source, date, territory, population, metric, and important methodological limits.
Explore more "Explainers"
Discover additional explainers across politics, science, business, technology, and other fields. Each explainer breaks down a complex idea into clear, everyday language—helping you better understand how major concepts, systems, and debates shape the world around us.