WMO Says 2026 Is Among Four Warmest Years as El Niño Intensifies
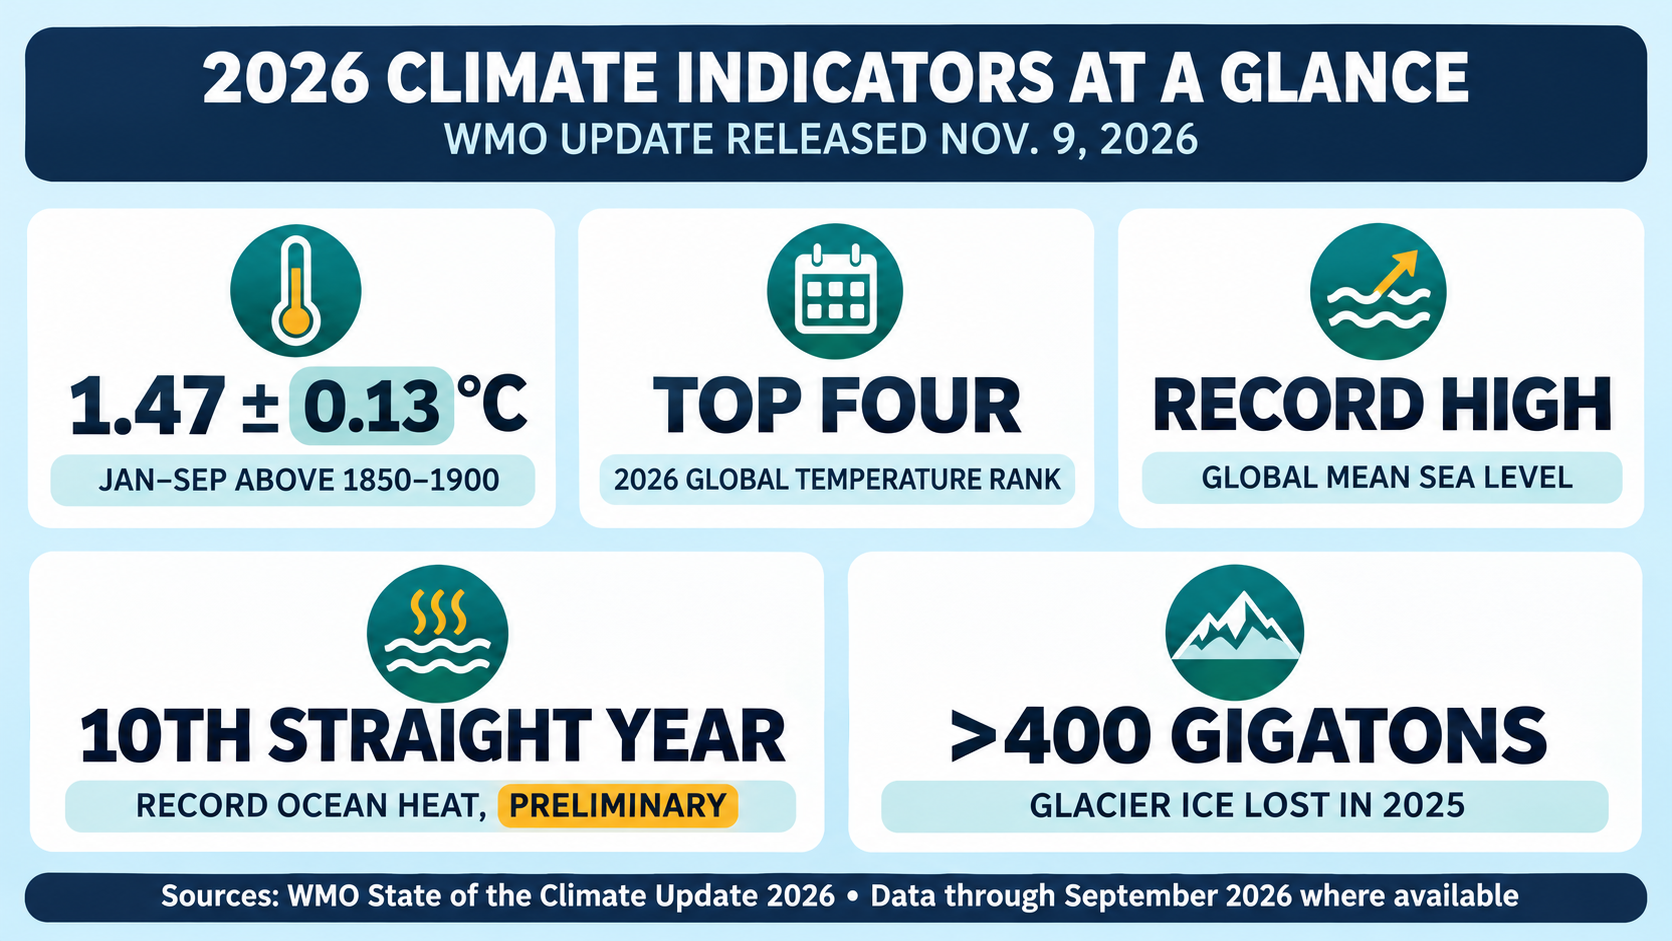
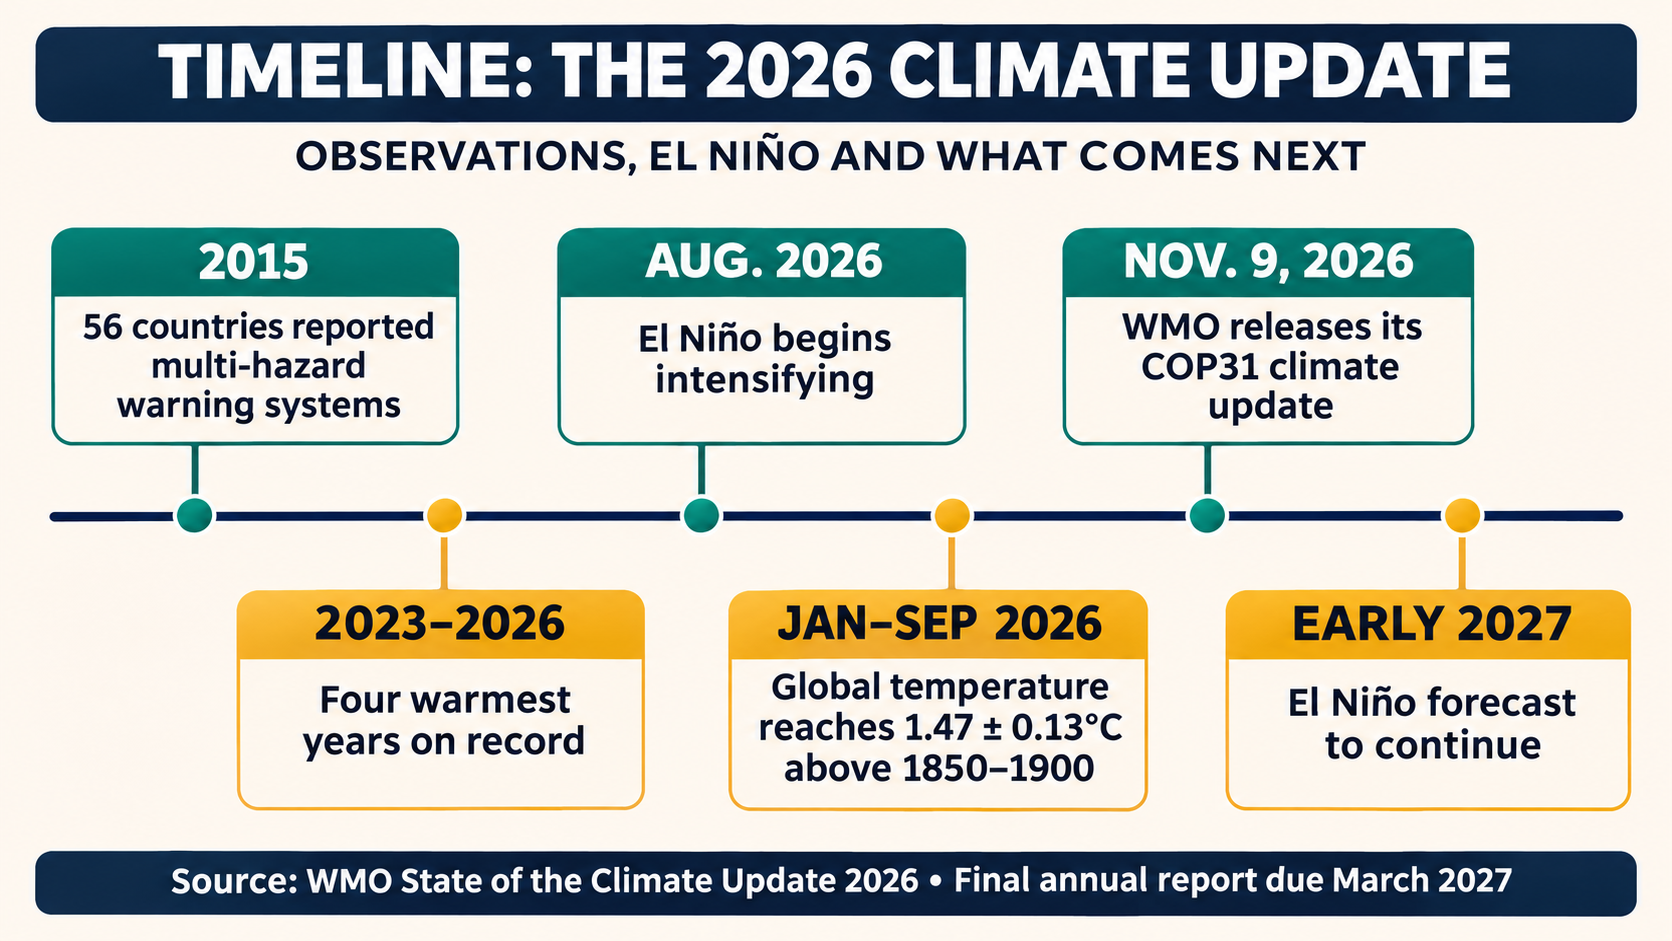
The World Meteorological Organization says the planet has remained in an extraordinary run of heat through 2026, with the year on track to rank among the four warmest in the instrumental record. The agency’s State of the Climate Update, released Nov. 9 as COP31 opened in Antalya, Türkiye, places the January-to-September global mean near-surface temperature at 1.47 degrees Celsius, plus or minus 0.13 degrees, above the 1850–1900 average.
The number is provisional rather than a final annual result. WMO used nine internationally recognized temperature datasets, and the report includes data through September where available. October observations and the final months of the year are not fully reflected. Even with that limitation, WMO says 2023 through 2026 are the four warmest years on record and that each of the past 12 years belongs to the warmest 12.
What the temperature figure means
WMO compares current temperatures with the late-19th-century period commonly used as a preindustrial baseline. The January-to-September anomaly is comparable to the full-year averages for 2023 and 2025, but below the 2024 record cited by WMO. Because different research groups use different observations and statistical methods, the exact annual ranking may vary by dataset when final results are released.
A single year near or above 1.5 degrees does not, by itself, mean the Paris Agreement’s long-term temperature goal has been formally crossed. That goal concerns sustained warming over a longer period, not one unusually warm month or calendar year. The present reading instead shows how close short-term global conditions are running to a threshold that governments agreed to pursue efforts to avoid.
The distinction matters because short-term natural variability sits on top of a long-term, human-driven warming trend. La Niña conditions had a temporary cooling influence early in 2026. That influence was overtaken as El Niño developed and strengthened from August, according to WMO. The warm phase of the Pacific cycle can release ocean heat into the atmosphere and typically lifts annual global temperature by about 0.1 to 0.2 degrees Celsius.
The ocean carries most of the extra heat
Surface temperature is only one part of the climate system. WMO says more than 90 percent of the excess energy accumulated in the Earth system enters the ocean. Preliminary measurements through July indicate that ocean heat content in the upper 2,000 meters continued rising in 2026 after reaching a record in 2025. If confirmed, 2026 would be the tenth consecutive year of record ocean warmth.
That stored heat has consequences that persist beyond the year’s temperature ranking. Warmer water expands, contributing to sea-level rise. Ocean heat can intensify tropical and subtropical storms, disrupt marine ecosystems and weaken the ocean’s capacity to absorb carbon. WMO says the warming already stored in the ocean will continue affecting the climate system for hundreds to thousands of years.
Global mean sea level reached a record high in 2026, the agency reports. June, July and August recorded the highest values since satellite altimetry began in 1993. WMO cautions that the sharp rise may partly reflect El Niño-related shifts in rainfall from land to ocean in the western tropical Pacific, while the long-term increase is driven by thermal expansion and melting land ice.
Ice and freshwater indicators also point in the same direction
Glaciers lost more than 400 gigatons of ice in 2025, an amount WMO equates to about one millimeter of global sea-level rise. All 19 glacier regions assessed by the agency lost ice for a fourth consecutive year. The report also says Antarctic sea ice reached its third-lowest annual maximum of the satellite era in 2026, while the Arctic maximum was either the lowest or second-lowest, depending on the dataset.
Water stored on land has declined globally since 2014. In 2025, 42 percent of the assessed global area had below-normal terrestrial water storage, compared with a long-term average of 25 percent. That measure combines water held in groundwater, soil, rivers, reservoirs, snow and glaciers. It does not mean that every location was dry, but it signals broad pressure on the freshwater systems communities and agriculture rely on.
El Niño adds a changing risk pattern
WMO expects El Niño to continue into early 2027 and says it was on course to reach record strength by December. The cycle does not produce the same weather everywhere. In some regions it raises the odds of drought, while elsewhere it can favor intense rainfall or unusual heat. Local impacts depend on season, geography and other atmospheric patterns.
The agency calls El Niño a risk multiplier because it operates on a climate system already carrying unusually high levels of heat. WMO links the combination to increased chances of heat-related illness, wildfire smoke, food insecurity and changes in water- and vector-borne disease risks. It also says rain-fed agriculture is particularly exposed where food insecurity is already high.
Forecasts have limits. A global climate update cannot say whether one town will flood, how long a heat wave will last or how much rain a farm will receive. Those questions require regional and national forecasts, shorter-range weather models and local observations. Readers should therefore treat the report as a risk outlook and a measure of the planetary background, not as an event forecast for a particular address.
Why the report arrived at COP31
The WMO release was timed for the first day of the two-week U.N. climate conference. COP31 negotiators are focused on turning existing commitments into implementation, including methane reduction, resilient cities, electricity systems, adaptation finance and support for countries facing climate losses. The summit’s hosts have said the world is likely to overshoot 1.5 degrees before temperatures can be brought back down.
The WMO report does not set climate policy. Its role is to assemble observations from national meteorological services, satellites, ocean networks and major research datasets so negotiators share a common scientific baseline. Separate U.N. reports assess national pledges and implementation. Those documents show progress in some areas but continue to find collective emissions reductions off track from what the science indicates is needed.
What happens next
WMO will publish its final State of the Global Climate 2026 report in March 2027. That version will incorporate later observations, more complete regional information and scientific contributions from national services and research centers. Annual temperature groups will also release their own final rankings, which may differ slightly because of methodology.
In the meantime, the agency emphasizes forecasts, observations and multi-hazard early-warning systems. The number of countries reporting such systems rose from 56 in 2015 to 136 in 2025. Coverage, reach and quality still vary, but the increase shows that preparedness can improve even while physical risks rise. The key near-term question is how quickly global signals are translated into trusted local warnings and practical decisions for health, water, food and infrastructure.
What the WMO Climate Update Means for Communities Preparing for 2027
The WMO’s 2026 climate update describes a global system carrying more heat, higher seas and less ice, with a powerful El Niño expected to continue into early 2027. For communities, the report is less a prediction of one disaster than a warning that familiar hazards may arrive with unfamiliar intensity or timing.
The practical starting point is local translation. El Niño can increase drought risk in one region and heavy-rain risk in another. It can also shift growing seasons, heat exposure and disease conditions. National meteorological services, public-health agencies and local emergency managers must connect the global signal to local forecasts before residents can act on it.
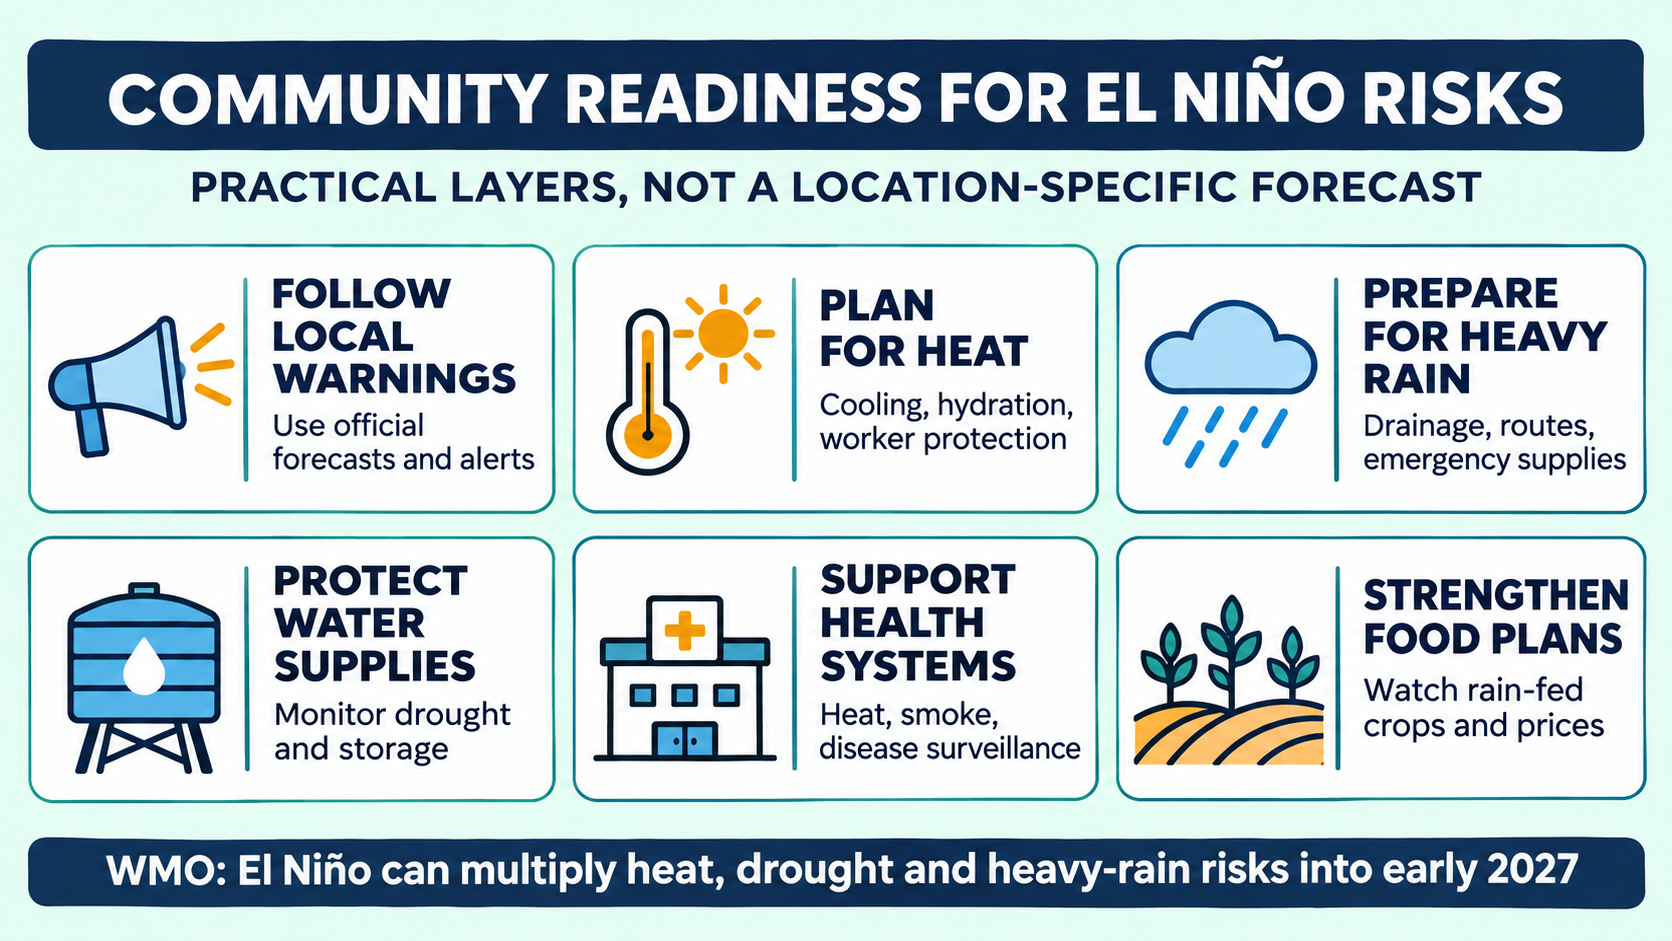
Heat plans need to reach people before temperatures peak
WMO says hundreds of millions of people were exposed to extreme heat during 2026. A community heat plan works only when thresholds, messages and services are set in advance. That can include opening cooling spaces, extending pool or library hours, checking on isolated residents, adjusting outdoor work and school schedules, and ensuring drinking water is available.
Heat exposure is unequal. Older adults, infants, people with chronic illness, outdoor workers, unhoused residents and households without reliable cooling face higher risk. A citywide alert may therefore require targeted outreach rather than a single public message. Language access, transport and electricity reliability can determine whether a safety plan is usable.
Employers and institutions also have roles. Work-rest cycles, shaded breaks, hydration and acclimatization protect workers when heat rises. Hospitals and clinics can monitor emergency visits and prepare for the combined effects of heat, smoke and power disruption. Schools and care facilities need indoor-temperature plans that account for vulnerable occupants.
Water planning has to address both scarcity and excess
The same climate pattern can produce very different water problems. WMO reports a long decline in water stored on land and unusually broad below-normal storage in 2025. Drought planning may require closer reservoir and groundwater monitoring, conservation triggers, support for small water systems and clear priorities for essential uses.
Heavy rain creates the opposite operational challenge. Drainage systems can be overwhelmed when rainfall intensity exceeds older design assumptions. Communities can clear known bottlenecks, inspect culverts, map safe routes and ensure warnings reach people in flood-prone housing. Residents should follow local guidance rather than infer flood danger from a global El Niño headline.
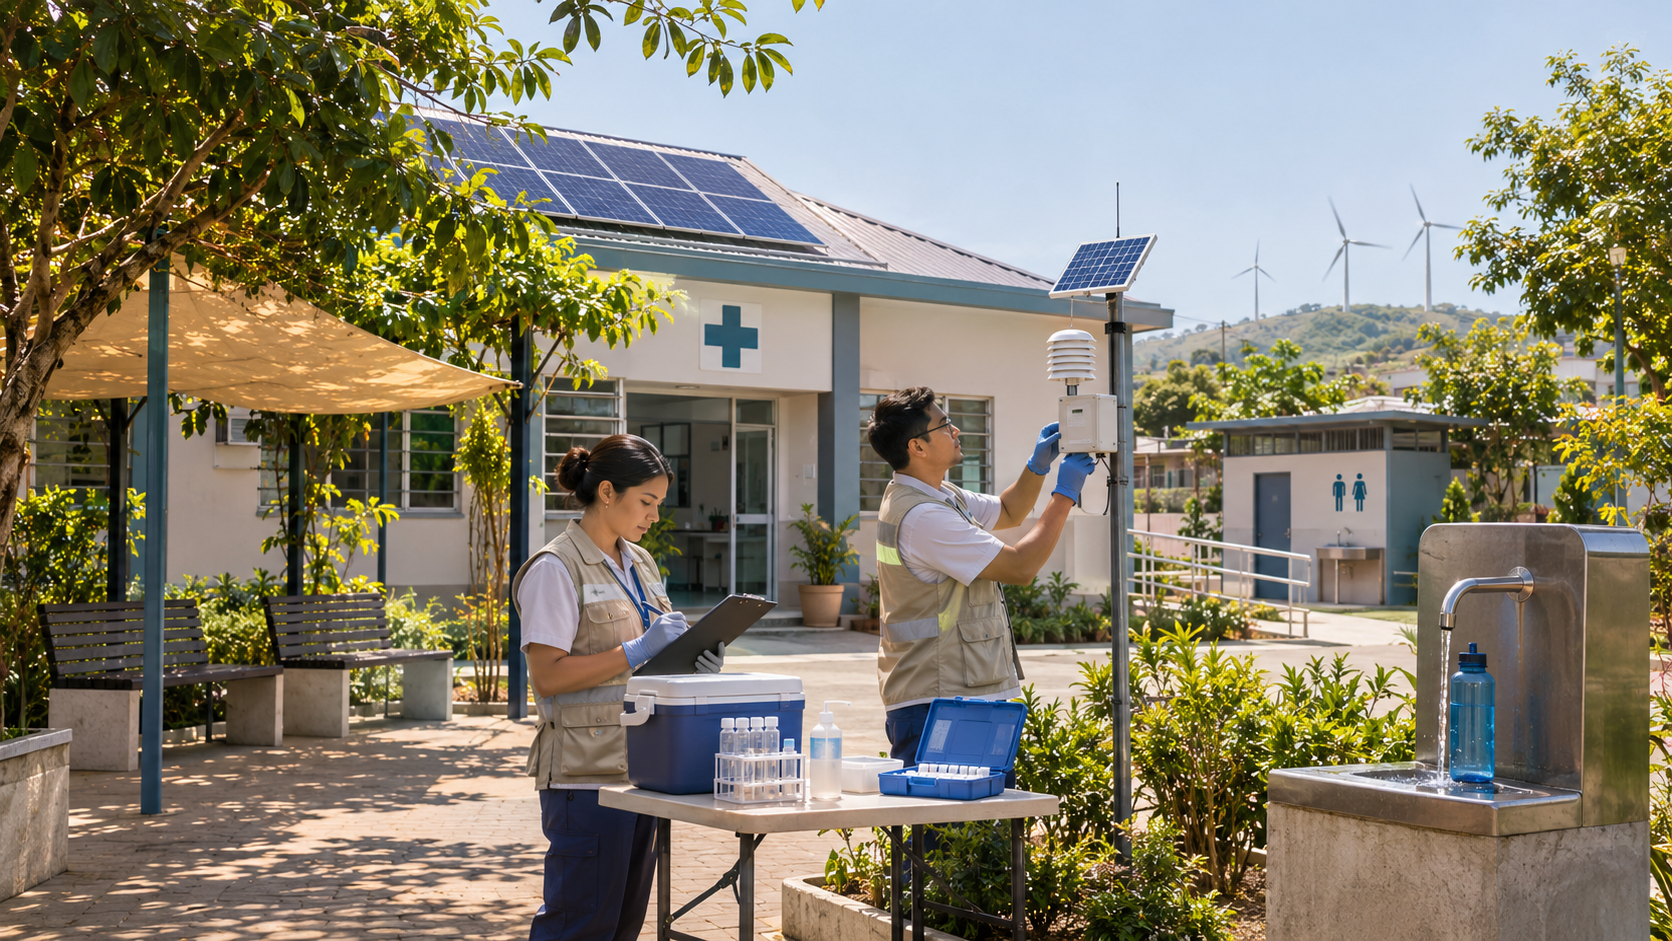
Water quality matters after both extremes. Drought can concentrate contaminants and reduce supply, while flooding can overwhelm sanitation systems and spread polluted water. Public agencies should communicate boil-water notices, testing results and distribution plans in plain language, with alternatives for people who cannot travel to pickup points.
Food systems feel climate signals through timing
WMO says El Niño is already increasing agricultural risks in key seasons, especially where food insecurity is high and farming depends on rainfall. A delayed rainy season, an intense downpour or prolonged heat can affect planting, livestock, storage and transport even when national production remains adequate.
Local readiness may include seasonal forecasts for farmers, drought-tolerant seed choices, livestock heat plans, crop insurance access and contingency purchasing for schools or food banks. Markets can transmit distant climate shocks through prices, so social-service agencies may need to monitor household food costs as well as local harvest conditions.
The report does not forecast a universal food shortage. It identifies conditions that can add pressure to vulnerable systems. Preparedness is most effective when agencies combine climate information with local data on crops, incomes, inventories and access to nutrition programs.
Health services need surveillance as well as emergency response
Heat, smoke, heavy rain and water changes can influence illness in different ways. WMO highlights heat-related mortality, poor air quality, malnutrition and changing risks from diseases such as cholera, malaria and dengue. The pathway depends on geography, infrastructure and public-health capacity.
Surveillance helps officials identify changes early. Clinics can share syndromic data, laboratories can monitor pathogens, and mosquito-control programs can track breeding conditions. Public messages should distinguish a heightened risk from an outbreak already occurring. Otherwise, broad warnings can create fear without helping people decide what to do.
Mental-health and displacement needs also belong in preparedness plans. Repeated evacuations, crop losses and extreme heat can increase stress and disrupt medication, schooling and care. Recovery programs work better when shelter, disability access, family reunification and continuity of care are planned before an emergency.
Early warnings are a public service, not just a forecast
Countries reporting multi-hazard early-warning systems increased from 56 in 2015 to 136 in 2025. The number shows progress, but the existence of a system does not guarantee that every person receives, understands or trusts an alert. Coverage can be weakest in remote areas, informal settlements and places with fragile communications.
An effective warning chain begins with observations and forecasts, then moves through government decisions, telecom networks, broadcasters, community organizations and household action. A failure at any link can leave people exposed. Redundant channels, accessible formats and clear instructions are as important as forecast accuracy.
Communities can test the chain through drills and after-action reviews. Officials should ask who did not receive the last warning, which routes failed, whether shelters were accessible and whether messages arrived in the right languages. Those questions turn a technical system into a learning system.
What residents can do now
People do not need to wait for a crisis to identify official alert sources, review medication and emergency supplies, discuss heat and evacuation plans, and check on neighbors who may need help. Households should base actions on local forecasts and instructions rather than viral maps or generalized claims about El Niño.
Preparedness also includes civic questions: whether cooling centers are reachable, flood routes are maintained, water utilities have backup power and public agencies explain uncertainty. The WMO update supplies a global reason to ask those questions. The answers will be local, and they will determine how much a climate risk becomes a community disaster.
Climate Readiness Depends on the Chain From Observations to Warnings
The WMO’s 2026 update is a reminder that climate security begins with measurement. A warming atmosphere, record ocean heat, rising sea level and retreating ice create interconnected risks for health, water, food, energy and infrastructure. Institutions cannot manage those risks from a single forecast or a single agency.
The relevant safeguard is a chain: sustained observations, credible forecasts, clear warnings, prepared services and financed resilience. Each stage has a different failure mode. Missing observations can hide a trend, a poorly communicated forecast can delay action, and an alert without transportation, shelter or medical capacity may not protect anyone.
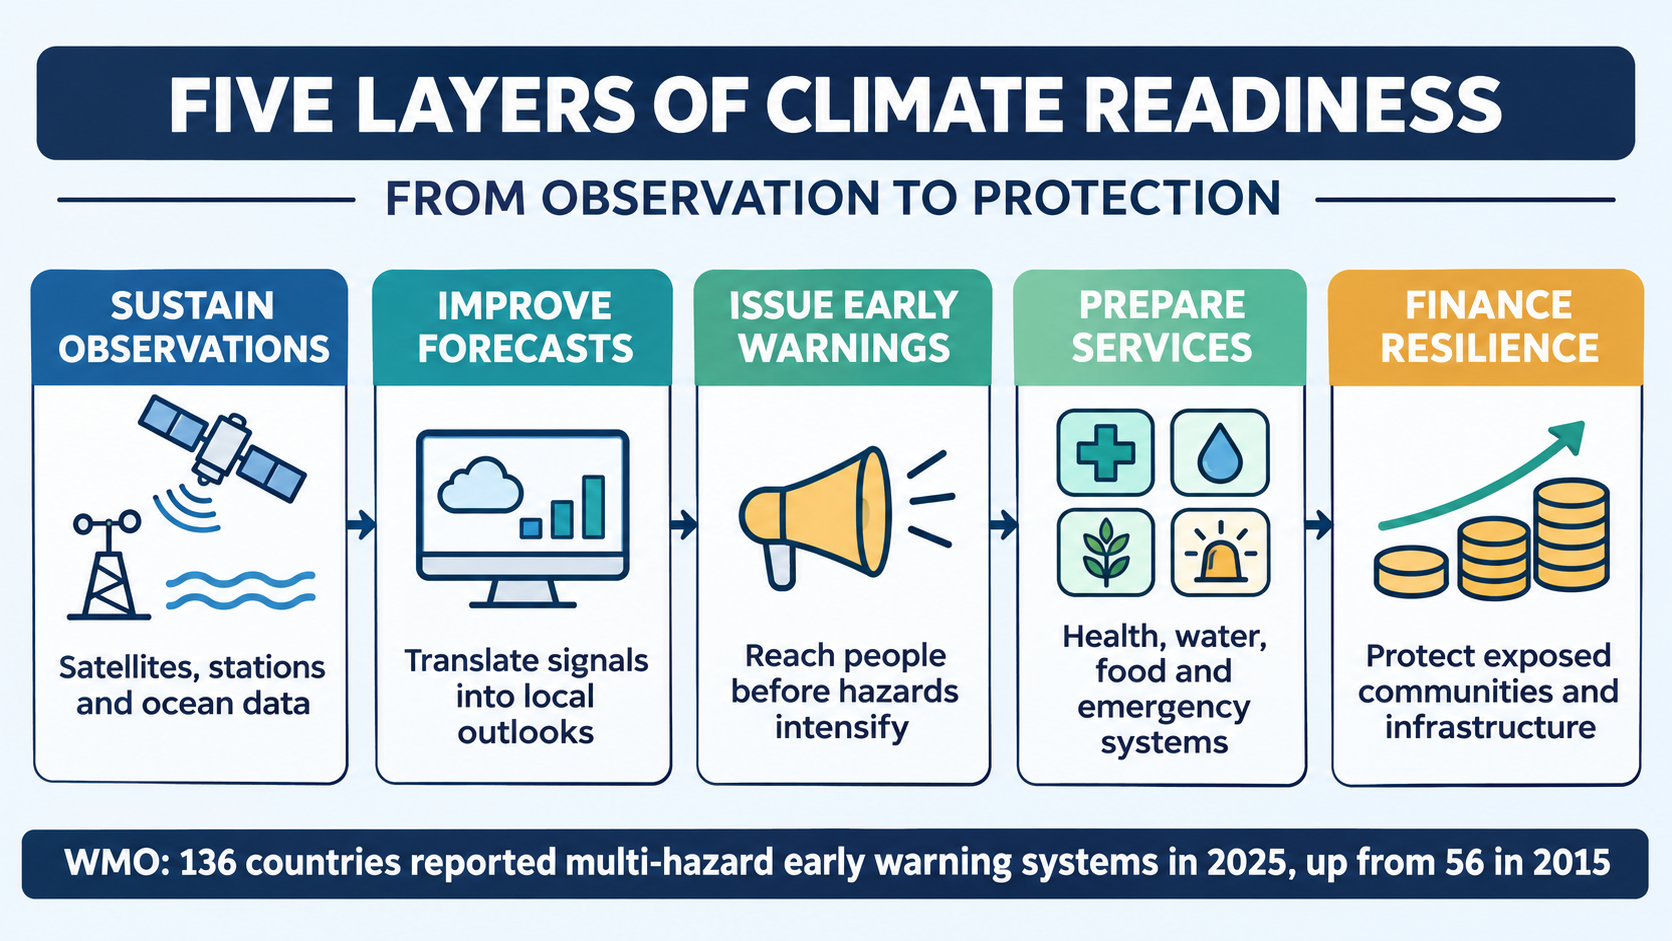
Observations are critical infrastructure
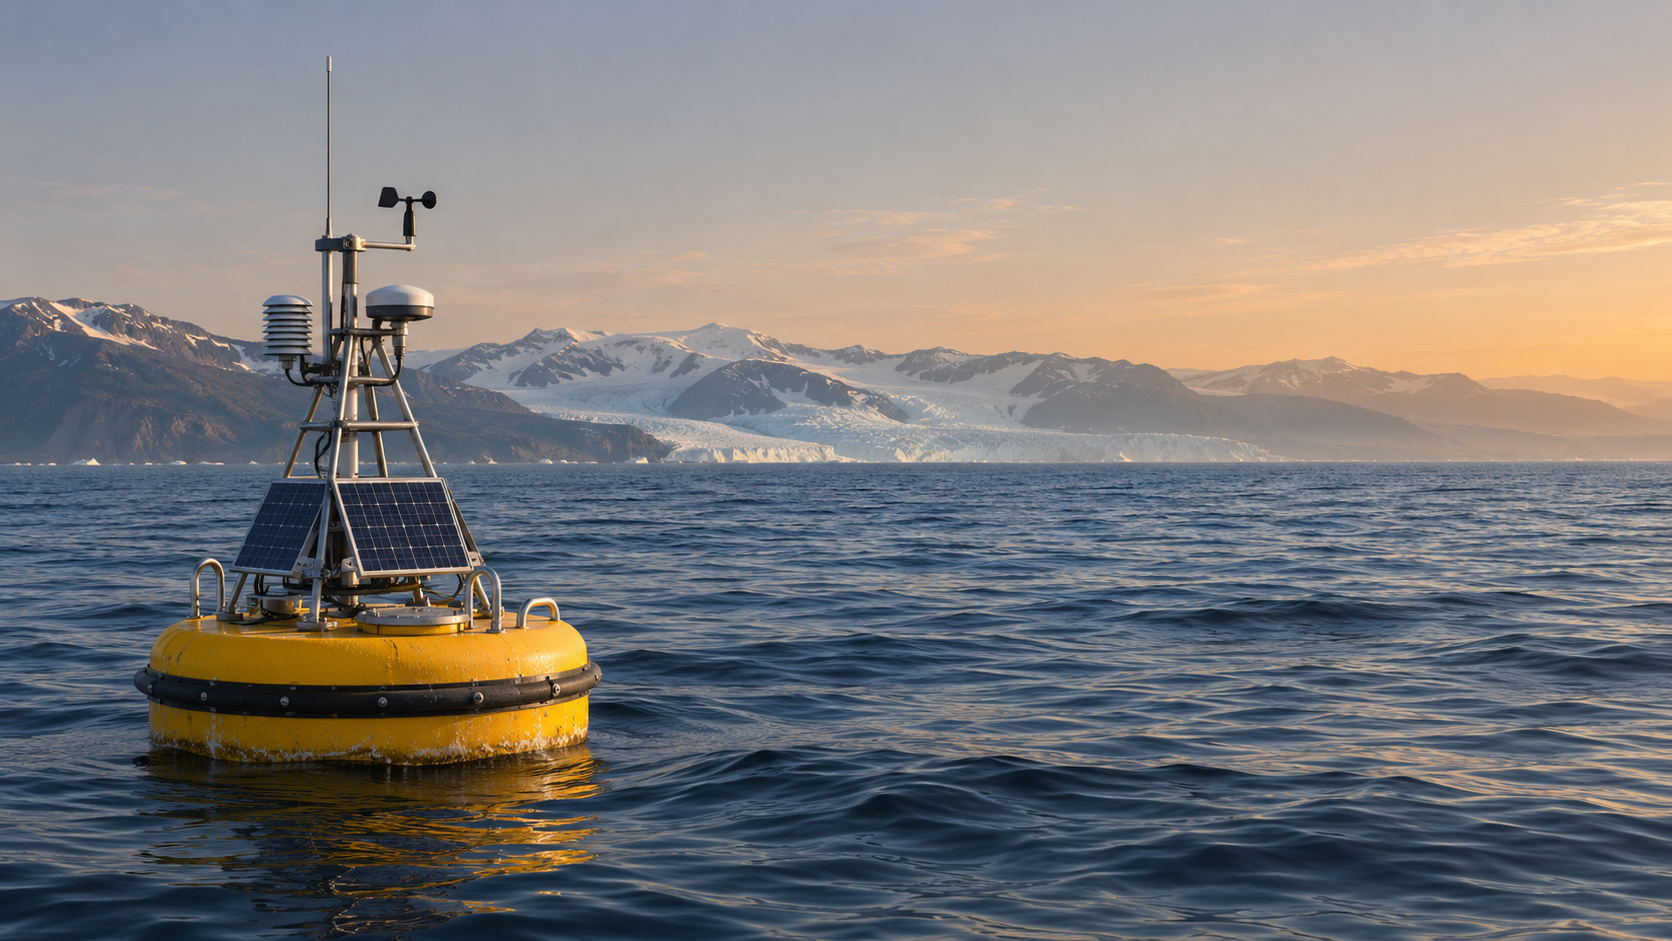
WMO’s temperature estimate draws on nine global datasets. Ocean heat assessments depend on ships, buoys and profiling floats. Sea-level records use satellites, while glacier and sea-ice measures combine field observations and remote sensing. Those systems require maintenance, calibration, data exchange and technical staff.
Gaps matter most where exposure is high and observing capacity is weak. A country may face severe heat, drought or coastal risk while operating few stations or relying on delayed data. International sharing can reduce that gap, but national services still need stable funding and communications to turn global products into local guidance.
Continuity is also important. Climate records become more useful as they lengthen because analysts can distinguish unusual events from normal variability. Abrupt funding cuts or instrument failures can create blind spots that affect forecasts, engineering standards, insurance models and public confidence.
Forecasts must preserve uncertainty
WMO expects El Niño to continue into early 2027, but the resulting hazards will not be identical across regions. Seasonal forecasts generally describe shifts in probability, not guaranteed outcomes. Decision-makers need to know both the likely direction of risk and the confidence around it.
Overstating certainty can be as damaging as saying too little. A drought forecast presented as inevitable may prompt costly actions that later appear unnecessary. A cautious message without operational thresholds may leave agencies waiting too long. Good practice ties probabilities to staged decisions that can be adjusted as new observations arrive.
Forecast products also need translation. A national outlook may be scientifically sound but too broad for a utility, hospital or farm. Sector specialists can convert climate information into water-demand scenarios, heat-health thresholds, crop advice and maintenance schedules while retaining the original uncertainty.
Warnings have to reach the last mile
Reported multi-hazard early-warning coverage expanded substantially between 2015 and 2025. That is a meaningful institutional gain. It does not establish that every system is equally reliable or that every exposed person is reached. Coverage, governance and trust vary.
A resilient warning system uses redundant channels. Mobile alerts, radio, sirens, social services, schools and community organizations can reinforce one another when power or connectivity fails. Messages should state the hazard, location, time window and recommended action. Accessibility for people with disabilities and translation into commonly used languages are operational requirements.
Authorities also need feedback. Delivery data, hotline calls, shelter use and community reports can reveal where an alert stopped. Post-event reviews should separate forecast error from communication or response failure so the correct part of the chain is repaired.
Essential services face compound risks
Climate hazards often arrive together. Heat can increase electricity demand while reducing generation efficiency. Drought can constrain hydropower or cooling water. Heavy rain can damage transport and communications. Smoke can worsen respiratory illness while hospitals are managing heat exposure.
Resilience planning therefore needs cross-sector dependencies. Utilities should know which medical facilities and water systems require priority restoration. Emergency managers need backup communications. Health agencies need plans for air quality, heat and disease surveillance. Food systems need storage and transport contingencies as well as production forecasts.
Engineering standards are another safeguard. Record sea level and accelerating ocean heat do not dictate one design for every coast, but they change the baseline used in long-lived infrastructure decisions. Planners need local projections, land-elevation data, maintenance histories and acceptable risk levels rather than a single global number.
Finance determines whether warnings become protection
Observation and warning systems cost money, but so do cooling centers, drainage, resilient power, health staffing and recovery. Lower-income communities often have the least ability to absorb losses or borrow for repairs, even though they may have contributed little to the emissions driving long-term warming.
COP31 negotiations are expected to focus heavily on adaptation and finance. Funding quality matters as much as totals. Short projects can buy equipment without sustaining staff or maintenance. Loans can add debt to countries already paying for repeated disasters. Effective finance links capital spending with long-term operations and transparent evaluation.
Accountability is essential. Governments and donors should publish what a project is designed to protect, which data support the decision and how performance will be measured. Climate urgency does not remove the need for procurement controls, community consultation or independent oversight.
What security framing can and cannot do
Calling climate change a security issue can focus attention on cascading risks and institutional readiness. It can also become misleading if it treats affected people as threats or reduces every climate problem to emergency enforcement. The WMO report emphasizes protection, forecasts and services rather than coercion.
The evidence supports a practical conclusion: climate readiness is strongest when science, public communication and essential services operate as one system. It does not support claiming that a specific disaster is certain, that every 2026 extreme was caused solely by climate change or that a strong El Niño will affect all places the same way.
The next test comes in 2027
The final annual WMO report is due in March 2027, while El Niño’s largest influence on global average temperature often occurs after the event develops. Agencies will need to update seasonal outlooks, health plans and water decisions as observations change rather than relying on the November snapshot indefinitely.
The central readiness question is whether institutions can shorten the distance between a global signal and a protective local action. More countries now report warning systems, but the decisive measures are reach, trust, response capacity and sustained maintenance. Those are the layers that determine whether better climate knowledge becomes greater safety.

Explore Related Streets
Discover interconnected perspectives across the Knowledge Streets —each Street brings its own lens to the news landscape.

Robot Streets
Robot Streets explores AI systems, humanoid machines, automation breakthroughs, and how robotics is reshaping work, industry, daily life, and the global economy.

AI Streets
AI Streets explores artificial intelligence breakthroughs, everyday tools, emerging risks, practical guides, and how AI reshapes business, creativity, work, and society.

AI Home Street
AI Home Street explores how smart tech transforms everyday living—security, cleaning, cooking, automation, voice assistants, and practical tools that make modern homes easier and more connected.

AIMakeMyDay
Your daily boost of AI-powered ideas—fun prompts, creative tools, and smart shortcuts designed to entertain, inspire, and make everyday life easier.

Nova Streets
Nova Streets explores everyday software from a user’s point of view—productivity tools, creative apps, business platforms, and more. We break things down with clear, hands-on insights, no jargon, and practical guidance that helps beginners and pros make smarter software choices..

AI Business Street
AI Business Street reports on automation, productivity tools, AI startups, enterprise adoption, market disruption, regulations, and how artificial intelligence is reshaping the global economy.
More in News




Explore our other News related sites:
AIMakeMyDay
AI Business Street
AI Education Street
AI Health Street
AI Home Street
AI Streets
Politics Street
Government Streets
Constitution Street
Defense Street
News Street Network